Underwriting EBITDA Adjustments in Sponsor-Backed Deals
Misaligned EBITDA add-backs can cost lenders millions in deal value and covenant cushion.

Underwriting EBITDA adjustments in sponsor-backed deals is not a matter of picking through a sponsor's add-back schedule and stamping items yes or no. It's a discipline for testing whether each adjustment reflects earnings power that will actually show up again next year, because at today's multiples, a few hundred thousand dollars of disputed add-backs can move enterprise value by millions and covenant headroom by a full turn or more. Covenant EBITDA, the negotiated figure written into the credit agreement, is what sets the leverage ratio, prices the loan, and determines how much room a borrower has to draw on incurrence-based baskets. It is the master variable the whole deal runs on, not a footnote. It is the master variable the whole deal runs on, and it routinely diverges from accounting EBITDA by a wide margin because it's a non-GAAP construct built through negotiation, not through an audit.
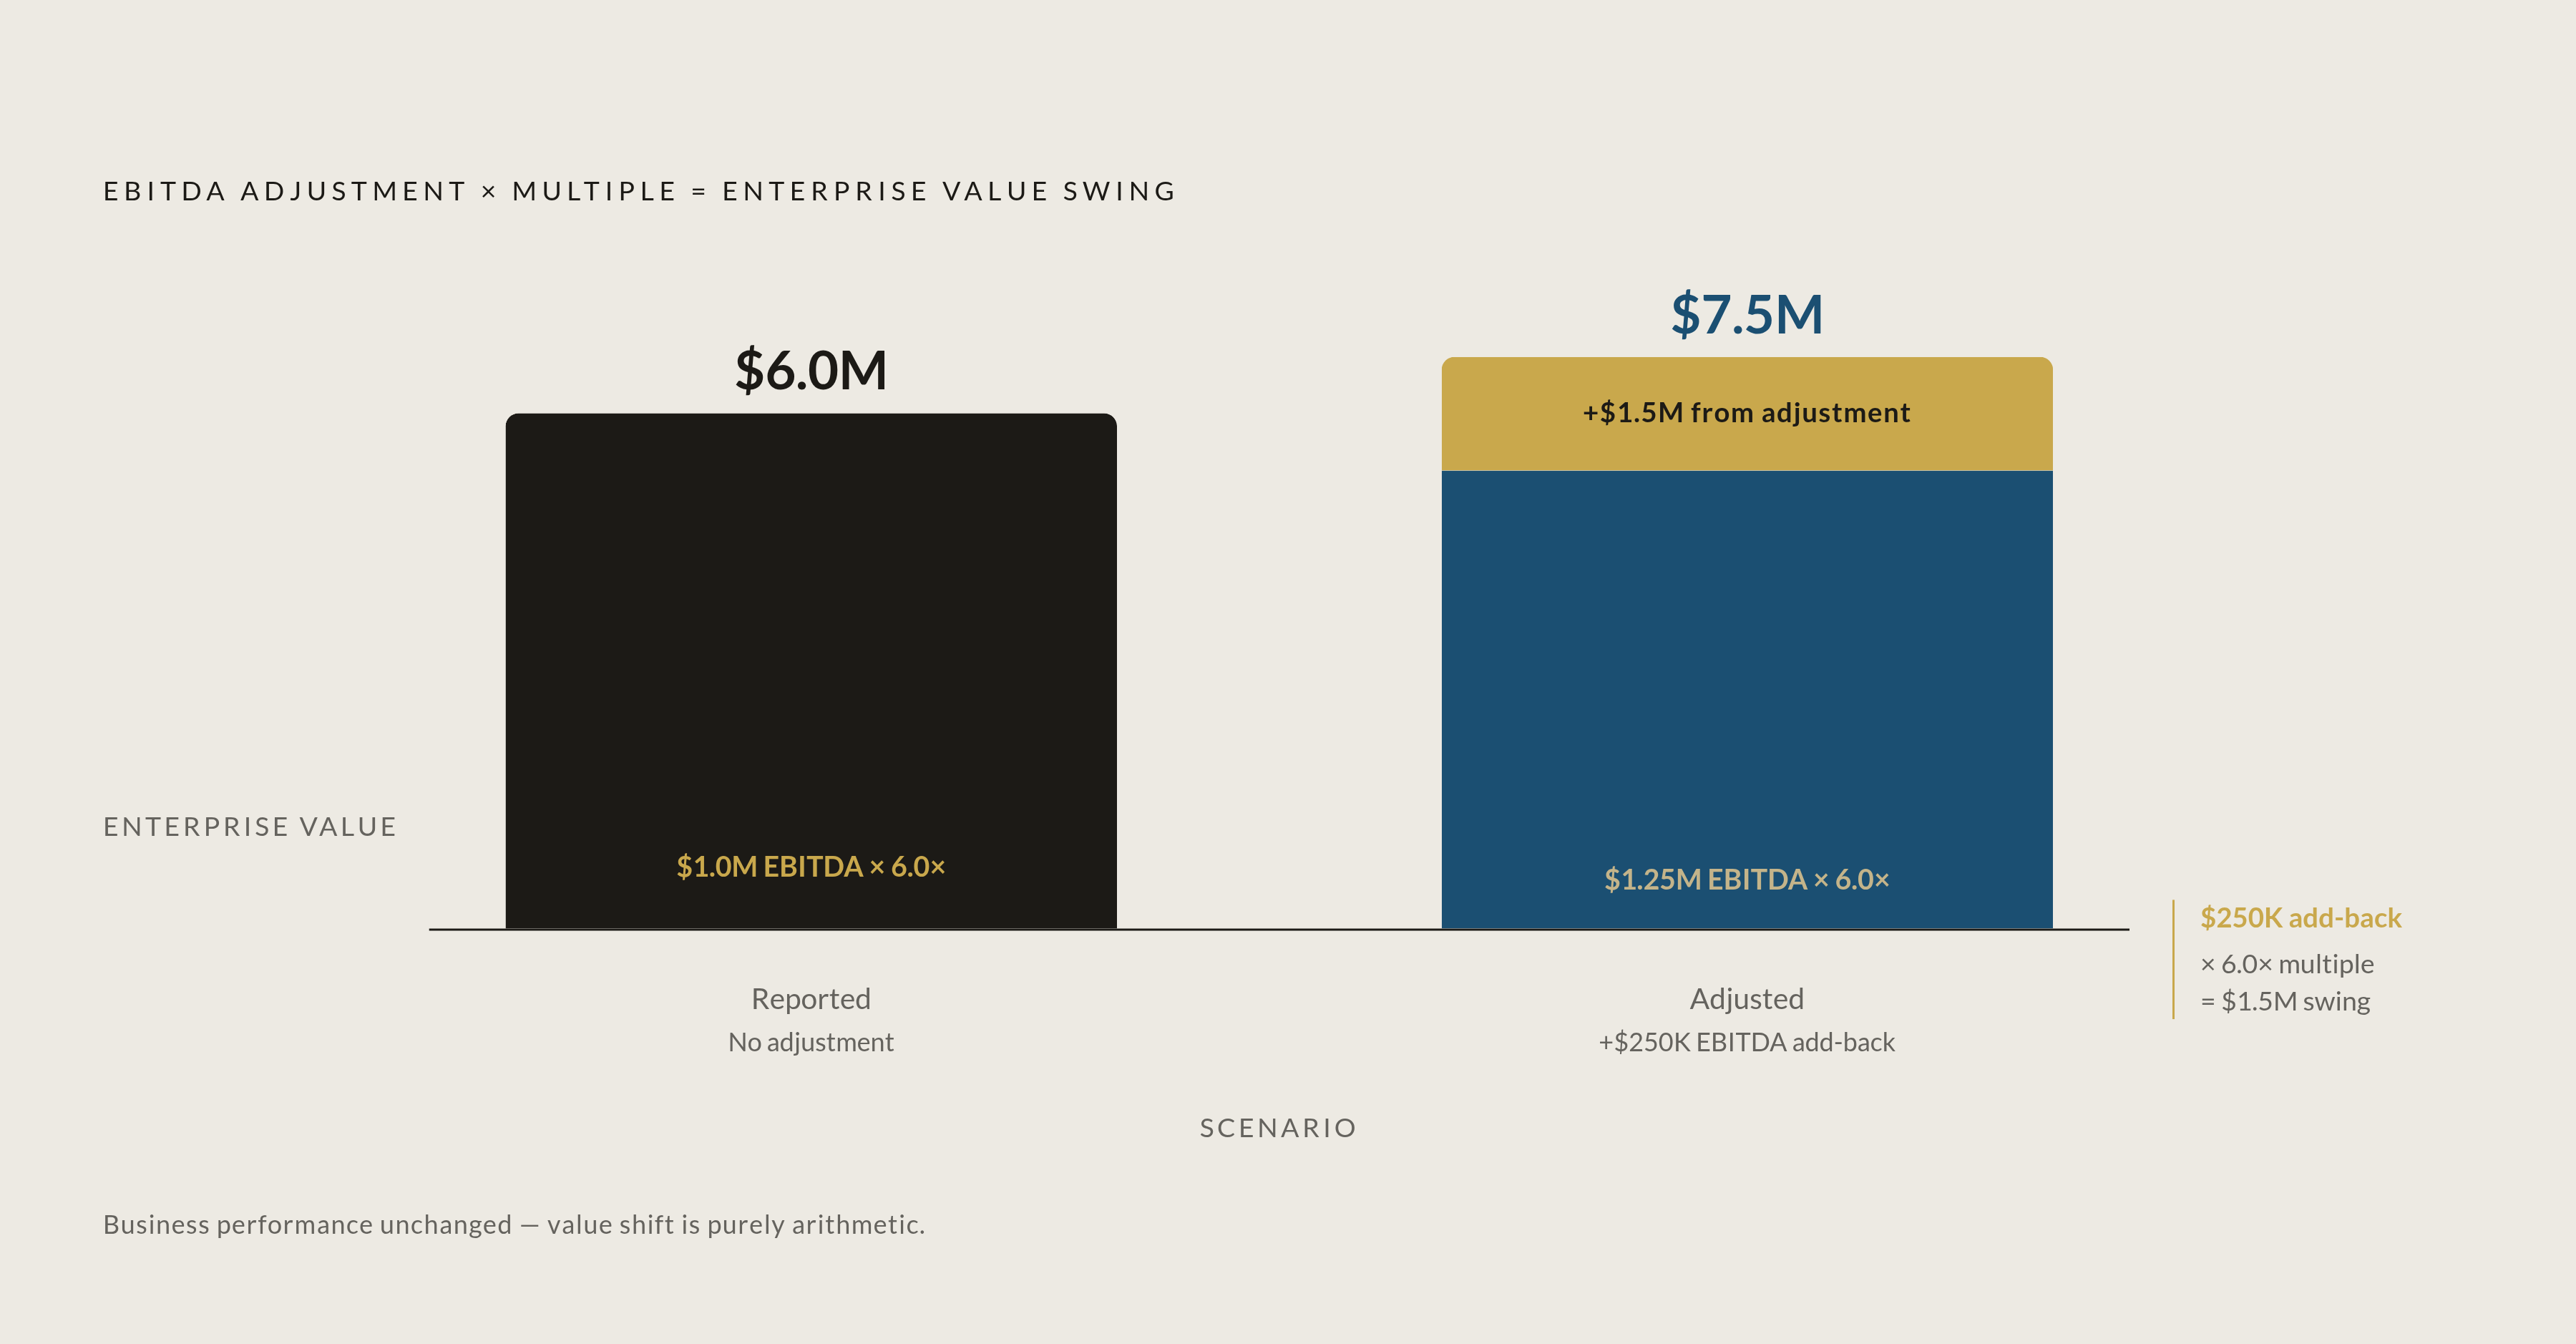
This matters so much because of how these deals get priced. Adjusted EBITDA, not reported earnings, is the number that gets a multiple applied to in the overwhelming majority of lower middle market transactions, on the order of 76% of cases. Run the arithmetic on a business reporting $1 million in EBITDA with $250,000 in adjustments layered on top: that's a $1.25 million adjusted EBITDA business. At a 6.0x multiple, the adjustment alone, not any change in the underlying business, produces a substantial swing in enterprise value. Multiplying that dynamic across a portfolio of deals means the adjustment conversation stops being a technicality. That substantial swing is the deal.
How large the adjustment problem is, and what the data show about accuracy
S&P Global studied 700 M&A and LBO transactions and found that adjustments made up 30% of management-adjusted EBITDA at deal inception, on a median basis. For deals originated in 2022 specifically, add-backs represented over 29% of management-projected EBITDA and nearly 55% of last-twelve-months reported EBITDA. That's more than half of reported earnings, restated by the sponsor before a lender even opens the model, not a rounding error sitting on top of a clean number. That's more than half of reported earnings, restated by the sponsor before a lender even opens the model.
What happens after close should give any credit committee pause. S&P's data show leverage missed by a median of 2.3 turns after year one and 2.7 turns after year two, across the full study period. Break that down by rating category and the picture doesn't improve much: B-rated companies missed by 2.6 turns in year one and 2.9 turns in year two, while BB issuers missed by 2.2 turns in year one. Neither cohort came close to hitting the underwritten number, and the gap widened with time rather than narrowing as the business matured into its projections.
Splitting the same data by transaction type reveals a further pattern. LBOs missed by 1.6 turns in year one but ballooned to a 3.3-turn miss by year two, while M&A transactions missed by 1.9x in year one. LBOs start closer to plan and drift further from it; M&A deals start further off and drift less. Either way, the adjustment built into the original underwriting turns out to be the least reliable number in the entire credit file.
The taxonomy lenders use to categorize adjustments before evaluating them
Quality of Earnings practice organizes the EBITDA bridge into three structural layers, and the distinction between them determines how much scrutiny each line item deserves. Definitional adjustments cover the EBITDA basics, interest, taxes, depreciation, and amortization. These are non-controversial by definition; nobody argues about whether interest expense belongs in the walk from net income to EBITDA.
Quality-of-earnings adjustments are the one-time items: settled litigation, M&A advisory fees, restructuring costs. These get tested on a single question, whether the item genuinely will not recur, and that test is where most of the diligence effort concentrates. Normalization adjustments cover recurring items that are priced incorrectly on the books, things like owner compensation set above market rate, related-party rent that doesn't reflect an arm's-length lease, or family members on payroll without a substantive role in the business.
The burden of proof sits with the seller on every single line, full stop. That means invoices, board minutes, lease comparables, contract amendments, and legal-counsel confirmation, not a spreadsheet footnote asserting the number without documentation. A defensible add-back needs source documentation backing the number, a narrative explaining why the item is genuinely non-recurring or owner-specific, a benchmark supporting any market-rate claim, and categorization consistent with how comparable transactions have treated the same type of item; these four things are needed to survive scrutiny.
Lenders build their own taxonomy independent of whatever bridge the sponsor hands over, and this is not redundant work. The seller's bridge is built to tell a story, typically one that maximizes the multiple. The lender's taxonomy is built to assess durability. The same line item, say, a one-time consulting fee tied to a systems migration, might be classified in the seller's "non-recurring" bucket while the lender's framework flags it as an ongoing cost of doing business that will resurface under a different label next year.
Add-back categories that generally survive lender scrutiny
Owner compensation normalization is the workhorse of legitimate add-backs, and it's also where the math gets misapplied most often. If an owner draws a $300,000 salary and the market rate for a general manager doing the equivalent job is $200,000, the add-back is $100,000, the excess amount, not the full $300,000. The replacement cost of running the business stays in EBITDA, because someone still has to do that job after the sponsor closes. This category is, in fact, the largest single add-back bucket in lower middle market deals, averaging 35% of total adjustments. Lenders spend so much time on it for that reason.
None of that works without a real benchmark. A government occupational wage survey, a staffing-firm salary guide, or an industry-specific compensation study all hold up under diligence. An undocumented assertion that "market rate is $200K" does not, and sophisticated lenders will strike the add-back entirely rather than accept a number with no source behind it.
One-time transaction costs, M&A advisory fees, financing costs, reorganization expenses, are defensible when they're tied to a completed, documented transaction with invoices in hand. They are not defensible when they're tied to pipeline activity that hasn't closed yet. Run-rate cost savings occupy similar territory: a borrower can reflect the lower annual cost of an initiative that's already been executed, such as a completed workforce reduction with documented savings, as if it had been in place from day one of the measurement period. What doesn't survive is a planned efficiency improvement that hasn't actually happened. Non-cash purchase accounting items, inventory step-ups and the amortization of acquired intangibles, are routine when confined to the initial recognition period, though lenders watch closely for double-counting against regular D&A that's already been added back elsewhere in the bridge.
Add-back categories that sophisticated lenders reject or heavily discount
Stock-based compensation sits at the top of the rejection list, and for good reason. It's non-cash, but it is not free: in people-intensive sectors, equity awards substitute directly for cash wages that the business would otherwise have to pay to keep the same talent in the seat. Sophisticated underwriting models retain SBC as a real expense almost universally, regardless of how the seller's Quality of Earnings report treats it. Where a lender does accept some SBC add-back, the price of that concession is typically a reduction of 0.5 to 1.0 turns off the underwriting multiple, a direct trade of leverage capacity for the credit given.
Non-recurring revenue misclassification gets policed even more aggressively, because the incentive to game it runs in the opposite direction from cost add-backs: sellers reclassify what is actually recurring revenue as one-time in order to inflate the forward run-rate the buyer will pay a multiple on. The diligence process catches a meaningful share of this. Roughly 31% of seller-proposed non-recurring revenue add-backs get reversed during diligence, which tells you the initial ask in this category should be treated with real suspicion from the outset.
Aspirational add-backs, the "we would have earned X if execution had gone better" variety, get no credit at all, because they are a projection dressed up as a normalization, not an adjustment to actual historical performance. Stale pandemic-era adjustments belong in the same bin. Adding back COVID-related lost revenue or cost disruption years after the fact was contested even in the immediate aftermath of the pandemic, and the SEC's own guidance suggested that certain COVID-related costs, idle employee pay and idled-facility rent among them, may be impermissible add-backs. There is no credible argument for reviving them now.
Why aggressive add-backs persist even when lenders know better
Given how well-documented the accuracy problem is, the persistence of aggressive add-backs looks less like an information gap and more like a structural feature of how these deals get done. Auction dynamics are the primary driver. A buyer who pushes back hard on a sponsor's add-back schedule risks simply losing the deal to a competing buyer willing to accept the schedule as presented. That's not an analytical failure on the skeptical buyer's part; it's a rational response to a competitive process that rewards the most permissive bidder.
There's a credibility constraint layered on top of that. Buyers who publicly and aggressively criticize a sponsor's add-backs risk damaging relationships with the advisers who send them deal flow in the first place, which mutes the feedback loop that would otherwise discipline the market over time. The absence of a standardized EBITDA definition compounds the problem further: credit agreements define EBITDA differently from deal to deal, which makes cross-deal comparison genuinely difficult and gives sponsors real room to negotiate an expansive definition into the document itself.
Syndicated market dynamics add one more layer. In the broadly syndicated loan market, periods of reduced lender negotiating leverage can coincide with less pushback on aggressive terms, as competitive allocation dynamics shift bargaining power toward borrowers. Direct lenders generally have more room to hold the line, given tighter, more bilateral relationships with borrowers, but they face their own deployment pressure that can erode that advantage in a competitive fundraising environment.
How lenders stress-test sponsor projections instead of simply accepting or rejecting them
Given all of that, the sensible approach for a lender is not a binary accept-or-reject exercise applied to each line item. It's a calibration exercise, one where each adjustment category gets assigned probability-weighted credit rather than full face value or a flat zero. That shift in framing is what separates disciplined underwriting from a rubber stamp.
Independent re-underwriting starts with the source documents rather than the sponsor's model. Lenders reconstruct the EBITDA bridge from invoices, contracts, and board minutes rather than accepting the sponsor's bridge as a given starting point, and they re-categorize every item using their own definitional, Quality-of-earnings, and normalization taxonomy before any credit gets applied. One screen does a disproportionate amount of the work here: the prior-year test. Any adjustment claimed as one-time that shows up in the same line item category in two or more prior years gets reclassified as recurring, no exceptions. That single mechanical check eliminates a large share of the aspirational add-backs that would otherwise slip through.
Run-rate verification handles the cost-savings category with a similar layered logic. Because they're observable in the actual financials, savings that have already flowed through the P&L get full credit. Savings from initiatives that are completed but not yet fully reflected in the trailing numbers get partial credit, phased in on a ramp schedule. Savings from initiatives that are merely planned, not yet committed or implemented, get no credit at underwriting whatsoever. That three-tier structure is what keeps a sponsor's optimism from becoming a lender's loss.
Add-back caps and covenant mechanics as structural enforcement of underwriting discipline
None of this analytical rigor matters much if it isn't written into the credit agreement itself. Add-back caps exist as a structural backstop for that reason. The convention is to cap individual add-backs, either by a fixed dollar amount or as a percentage of EBITDA, and then cap the aggregate of all add-backs combined as a separate percentage of EBITDA. The most common market reference point for that aggregate cap is around 25% of EBITDA.
That cap functions as a mechanical ceiling on how far a sponsor's storytelling can push the covenant number, regardless of how persuasive any individual add-back narrative sounds in the room. Given that S&P's data show actual leverage missing underwritten leverage by more than two turns within the first two years of a deal, on average, a hard percentage cap is one of the few enforcement tools that holds regardless of how the negotiation over any single line item plays out. It doesn't replace the underwriting judgment described above. It backstops it, for the cases where judgment alone wasn't enough to hold the line.